본문
PPtreeViz: An R Package for Visualizing Projection Pursuit Classification Trees
By Prof. Eun-Kyung Lee (lee.eunk@ewha.ac.kr)
Department of Statistics
Projection pursuit uses the projection pursuit index and optimization procedure to find an interesting low dimensional projection. Such an interesting feature is defined by the projection pursuit index, and we usually maximize the predefined projection pursuit index to find an interesting projection. An interesting projection for classification is a view with the most separable classes. Several projection pursuit indices with class information have been suggested.
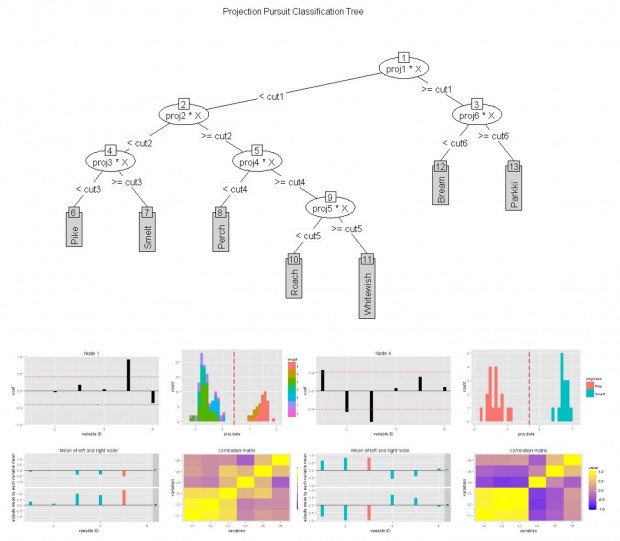
The projection pursuit classification tree is a new approach to build a classification tree using projection pursuit indices with class information. At each node, the projection pursuit classification tree uses the best projection to separate two groups of classes using various projection pursuit indices with class information. One class is assigned to only one terminal node, and the depth of the projection pursuit classification tree cannot be greater than the number of classes. Therefore, the projection pursuit classification tree constructs a simple but more understandable tree for classification. The projection coefficients of each node represent the importance of the variables to the class separation of each node. The behaviors of these coefficients are useful to explore how classes are separated in a tree.
PPtreeViz is an R package to explore projection pursuit methods for classification. It provides functions to calculate various projection pursuit indices for classification and to explore the results in the space of projection. It also provides functions for the projection pursuit classification tree. The visualization methods of the tree structure and the features of each node in PPtreeViz can be used to easily explore the projection pursuit classification tree structure and determine the characteristics of each class.
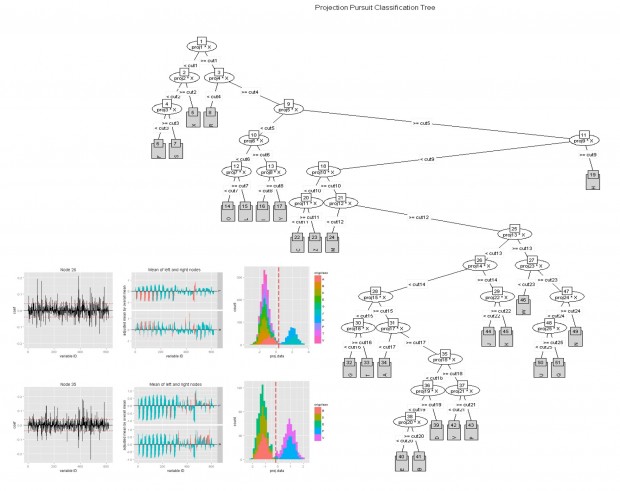
The projection pursuit classification tree focuses on the exploratory analysis as well as the precision of classification. With this tree structure, we can determine the variables that play important roles in each separation. Thus, it is essential to explore each node in the projection pursuit classification tree structure and to find out how to divide classes into two groups. It is the main advantage of the projection pursuit classification tree. Therefore, we need to develop tools to explore the projection space of each node. PPtreeViz provides two functions to explore the projection pursuit tree - plot and PPclassNodeViz. For the plot with the tree structure, we modified the plot for BinaryTree in the party package. The plot function in the party package shows inner nodes with node id and edges with the condition. For the terminal nodes, however, it represents summary statistics for the classification results. For the projection pursuit classification tree, we need to show the name of the class and the node id for the terminal node. Also, the plot in the party package cannot represent the complicated tree with a large number of the terminal nodes without overlapping. Therefore, we need to resolve these problems and improve the plot in the party package. The plot function in PPtreeViz is a generic plot function for an object with PPtreeclass class, which is the result of the PPtreeClass function. The font.size and width.size options are available for a large tree with a large number of groups.
* Related Article
PPtreeViz package
Lee, E., PPtreeViz: An R Package for Visualizing Projection Pursuit Classification Trees, Journal of Statistical Software, Vol. 83 Issue 8, Feb. 2018
Lee, Y., Cook, D., Park J. & Lee, E., PPtree: Projection pursuit classification tree, Electronic Journal of Statistics, Vol. 7, 1369-1386, 2013


